Correlation Matrix
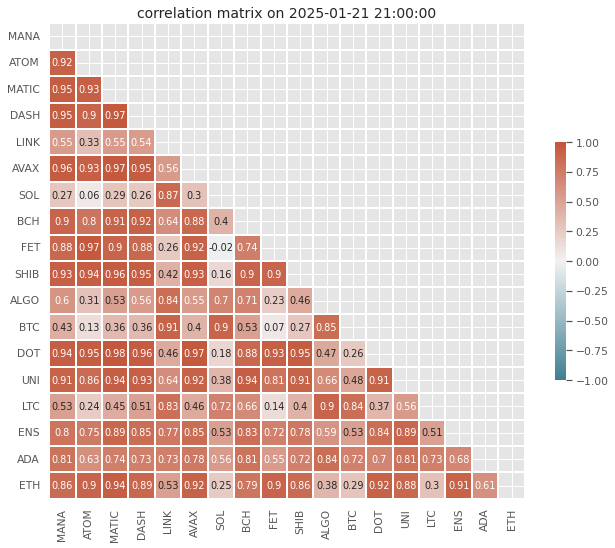
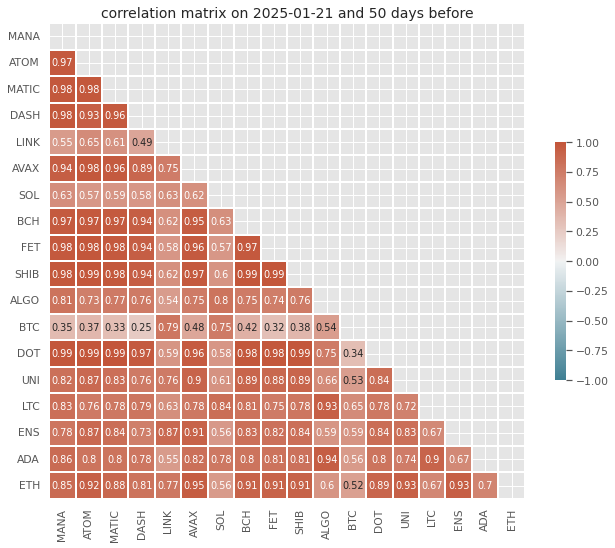
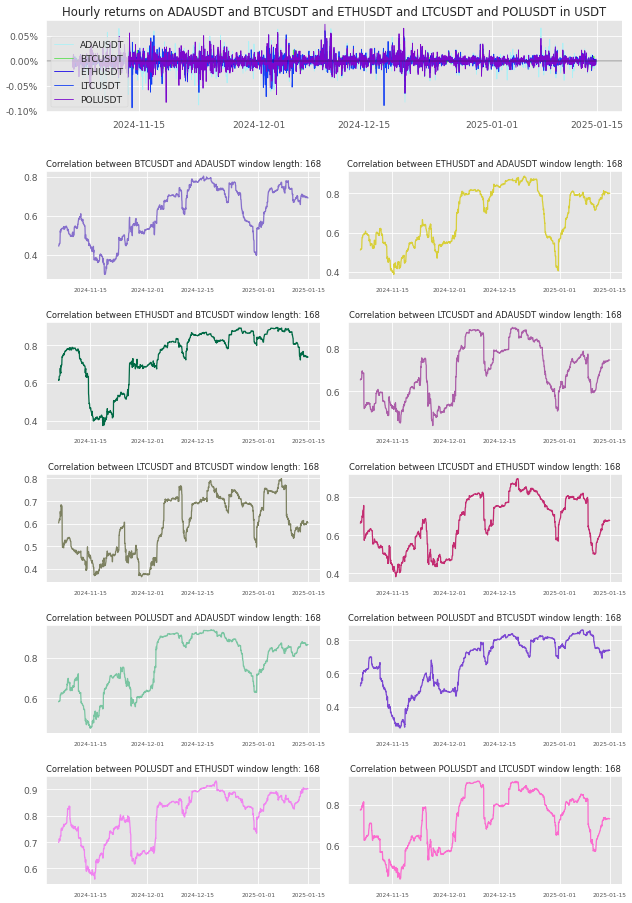
Daily and hourly correlation. The source is Coinbase.
This page is updated daily at 12:00 PM GMT.


Return Correlation
(Closer to 1 - Returns are similar, closer to 0 - Returns are not similar)

More Charts
Understanding 50-day and 200-day Moving Average Analysis
The 50-day and 200-day moving averages are important tools used in technical analysis to assess trends in the market.
What are Moving Averages?
A moving average smooths out price data by calculating the average price over a specific number of days:
- 50-day MA: Represents the average price over the last 50 days and is a shorter-term indicator.
- 200-day MA: Represents the average price over the last 200 days and is a longer-term indicator.
Key Concepts
Two important signals traders watch for when these moving averages cross:
- Golden Cross: When the 50-day MA crosses above the 200-day MA, indicating a potential upward trend (bullish signal).
- Death Cross: When the 50-day MA crosses below the 200-day MA, indicating a potential downward trend (bearish signal).
How to Use in Trading
The 50-day MA helps identify short-term trends, while the 200-day MA helps determine long-term trends:
- If prices are above both moving averages, it suggests a strong uptrend, and traders might consider buying.
- If prices are below both moving averages, it suggests a downtrend, and traders might consider selling or holding off on buying.